Graphs templates
Browse our free templates for graphs designs you can easily customize and share.
Futuristic Abstract Line Graph with Colorful Peaks and Cityscape Bars Poster

Intricate White Wireframe Letter G on Teal Background Monogram

Modern Minimalist Data Analyst Illustration for Social Media Post

Zigzag Green Plant Growth Line on Gray Background Background

Playful Minimalist Quadrant Pattern with Bold Colors and Shapes Seamless Pattern

Cheerful Cartoon Achieve Grapeness Grape Character T-Shirt

Intricate Black and White Grape Cluster Line Drawing Coloring Page

Stylized Elegant GD Monogram Design on White Background Monogram

Expressive Ink Wash Monogram 'G' Art on White Background Monogram

Minimalist Colorful 2x2 Grid Graphic Elements Pattern Seamless Pattern
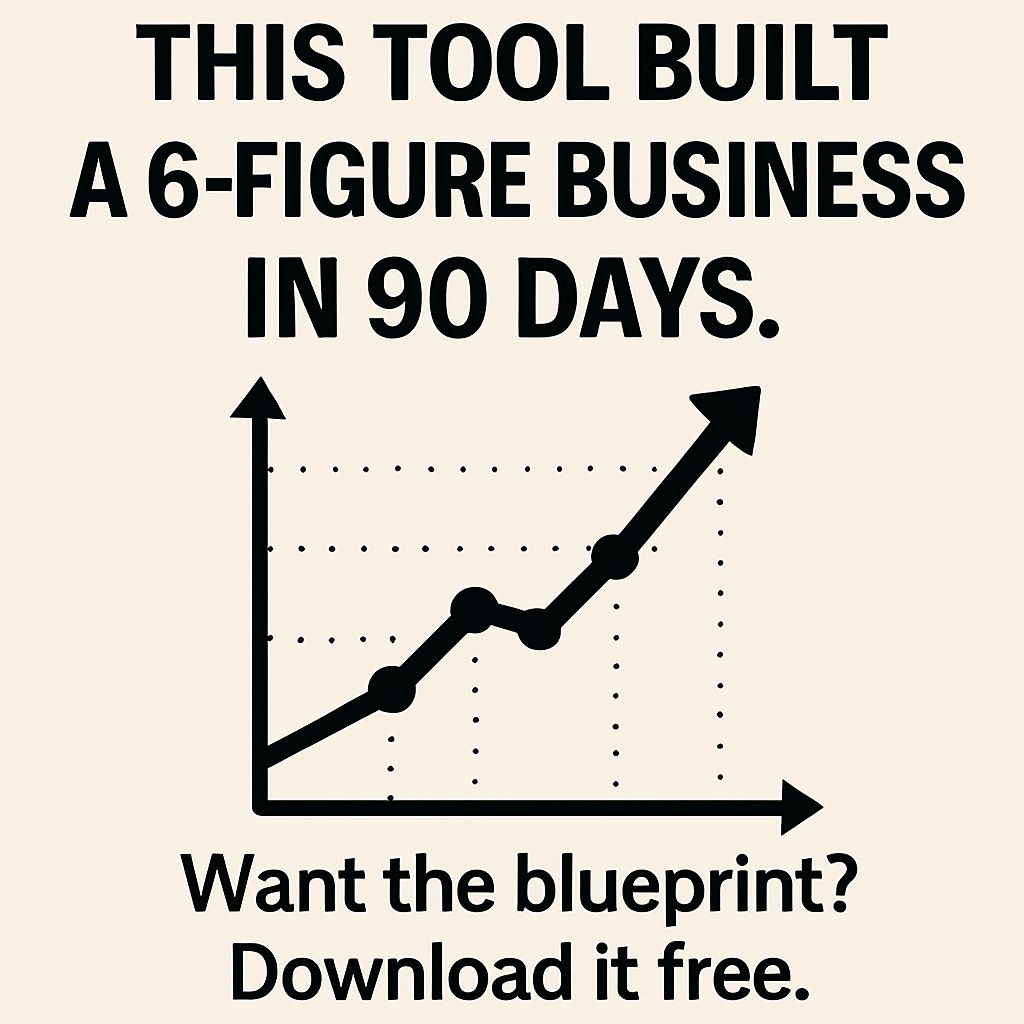
This Tool Built a 6-Figure Business in 90 Days Graphic Ads

Modern Abstract Geometric Shapes Seamless Pattern Design

Ominous Matrix Graphic with Red Silhouettes for Social Media Post

Dramatic Metallic It's Over Graphic with Fiery Background Social Media Post

Evolution of Humanity and Golfing Silhouettes Sticker

Vibrant Modern Levelo Charts Logo Design with Gradient Background Logo
Vibrant Floral Smiling Face Graphic T-Shirt

Vibrant Geometric Letter G Art with Colorful Paper Design Monogram

Black and White Line Drawing of Grapes Coloring Page
Modern Minimalist Financial Analysis Journal EBook Cover

3D Geometric Letter G Design in Gradient Blue Teal Monogram

Elegant Black and White Gazebo Illustration for Coloring Book Pages
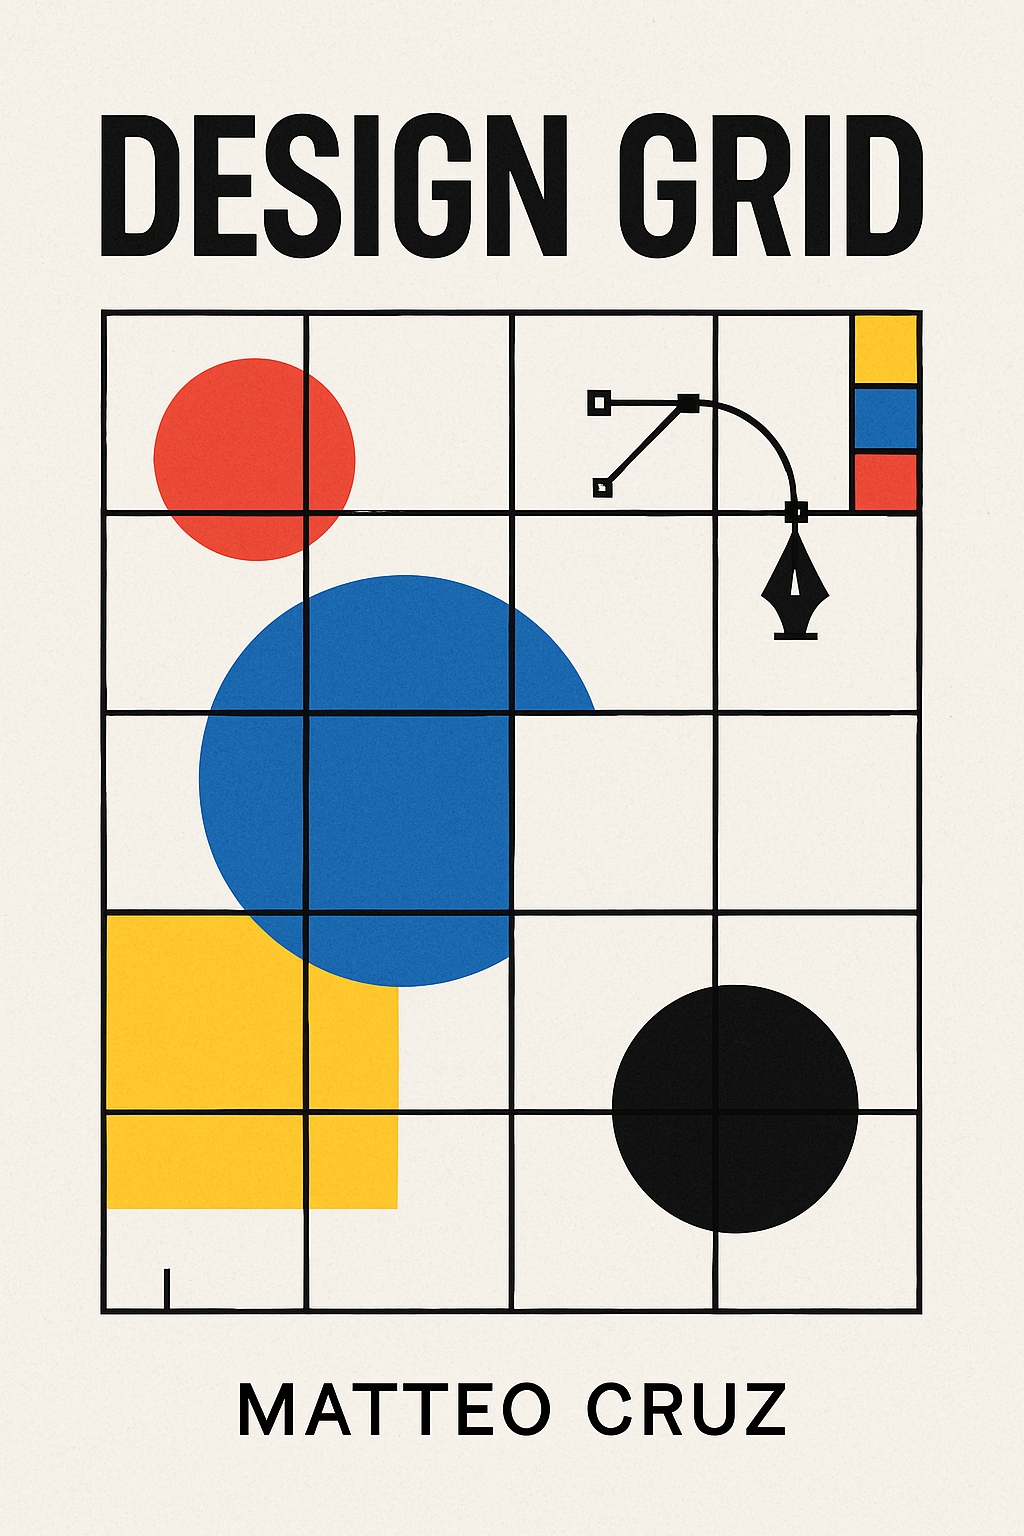
Minimalist Design Grid Poster Featuring Bold Geometric Shapes EBook Cover
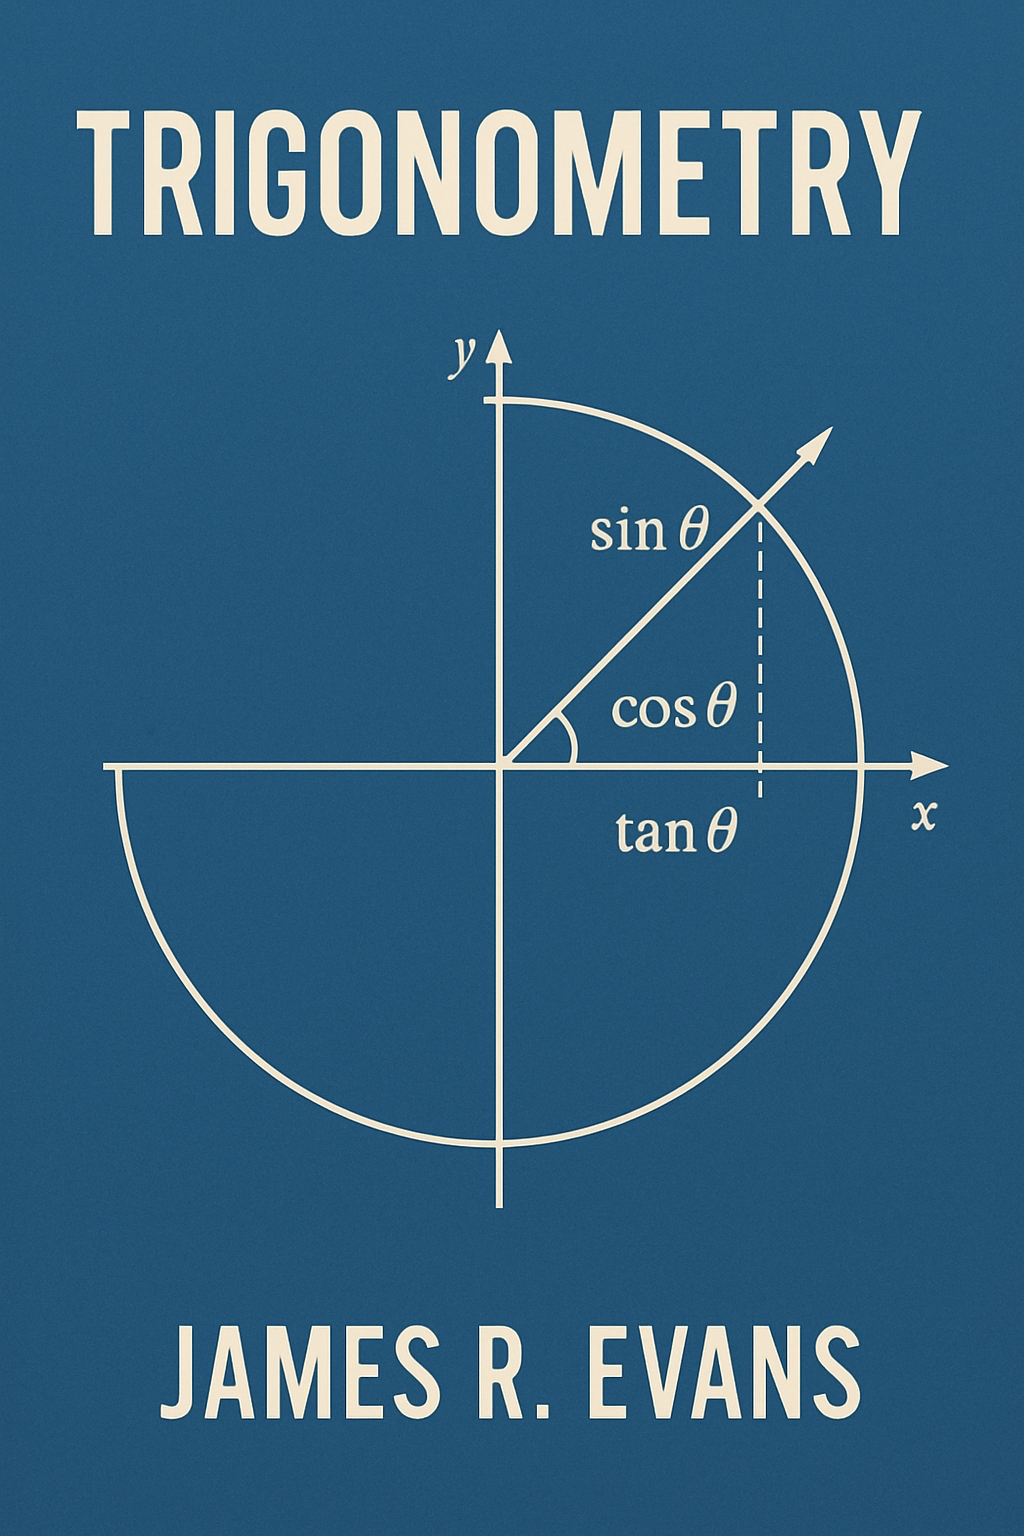
Minimalist Trigonometry Book Cover with Graph Illustration EBook Cover

Minimalist Economic Trends Journal Cover with Graphs and Arrows EBook Cover

Vibrant Yellow and Blue Curved Diamond Logo Design

Stylized Graffiti Art of Hand Reaching for Pixelated Cursor Art

Modern Abstract Hands Interacting with Colorful Icons Banner

Modern Minimalist Math Club Growth Logo
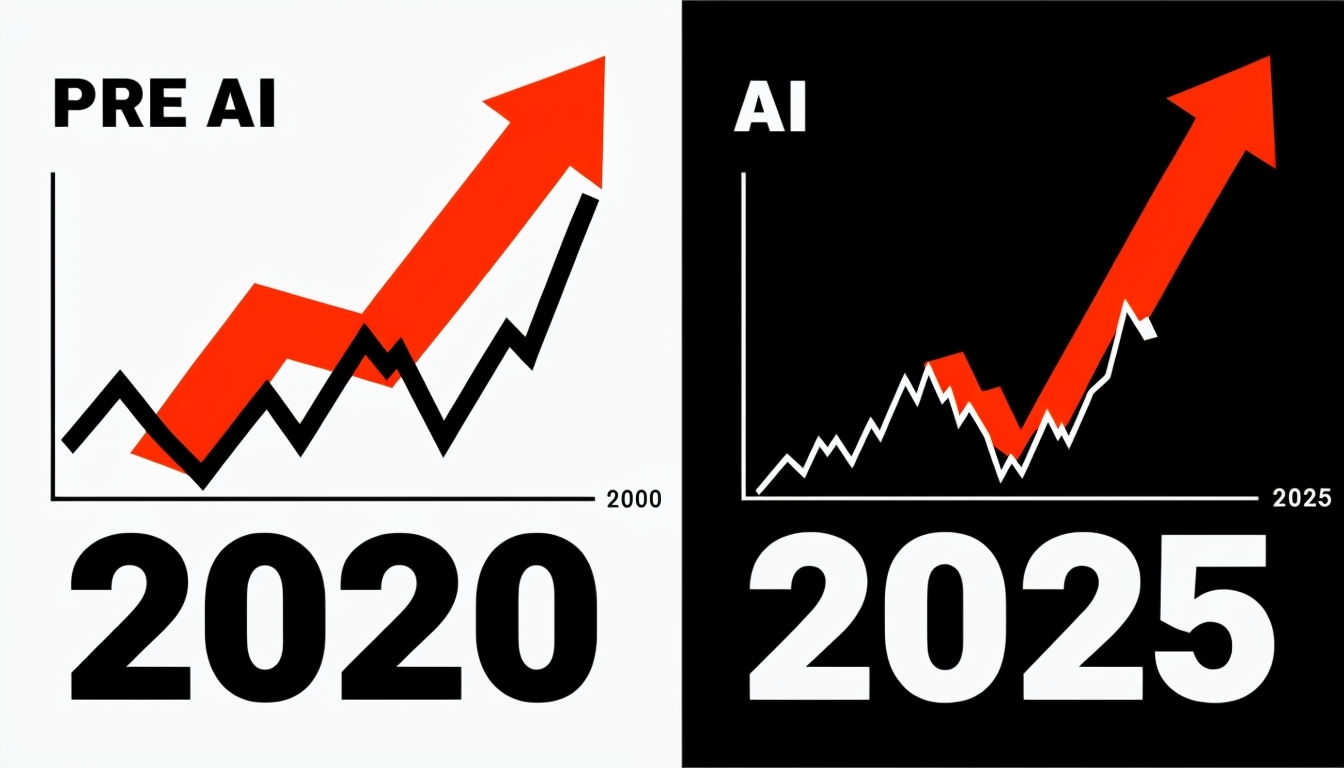
Tech Trends Comparison: PRE AI vs AI Growth Graphs Social Media Post

Chaotic Red Lines Overwhelming Figure Illustration Mobile Wallpaper

Minimalist Black and White Zigzag Lines Journey Illustration Coloring Book Pages

This Makes Me RICH Bold Graph Illustration for Social Media Post

Elegant Grape Silhouette Abstract Design T-Shirt
Bold Blocky GRID Typography Illustration on Bright Orange Logo

Whimsical Sketch of Person Hanging from a Bar Art

Minimalist Human Brain and ECG Line Graphs Art Poster
Modern Minimalist Geometric Shapes Seamless Pattern Design

Lush Green Grass Letter 'G'

Higher IQ? Promotional Graphic Featuring Math and Science Concepts Social Media Post

Vibrant Green Plant Growth Chart Art for Modern Spaces Virtual Backgrounds

Stylized Deer Abstract Bar Chart Graphic Phone Case Cover
Cartoon Mood Swings Illustration with Happy and Sad Faces Sticker
Playful Tie-Dye Math Face Illustration with Colorful Swirls Poster
Minimalist Data Speaks Book Cover Design with Pie Chart EBook Cover
Whimsical Fruit Shapes Illustration with Circular Sun Mobile Wallpaper
Modern Minimalist Learning Curve EBook Cover Design

Smiling Yellow Face with Beanie and Grify Text T-Shirt

Geometric Bridge Journey Across a Surreal Abstract Chasm Mobile Wallpaper

Geometric 2x2 Grid Design with Vibrant Shapes Seamless Pattern
Graphs by Playground
Graphs are fundamental tools for visualizing data, making complex information easy to understand and interpret. Whether you're a student, a data analyst, a business professional, or a researcher, graph templates can save you time and effort in creating visually appealing and accurate representations of your data. From line graphs and bar charts to pie charts and scatter plots, these templates cater to a multitude of use cases. They are ideal for presentations, reports, academic projects, or even for personal use, such as tracking your fitness progress or financial milestones. Playground offers a comprehensive collection of graph templates that are free and easy to use. With our intuitive platform, you can quickly find the perfect template to match your needs. Each template is expertly designed to ensure clarity and professionalism, allowing you to focus on what matters most—analyzing and presenting your data. Playground caters to users of all skill levels, making it simple for anyone to create beautiful, informative graphs without any design experience. Plus, every graph template on Playground is customizable so you can tweak it to fit your specific needs, whether that involves changing colors, fonts, or data sets. Once you've selected and personalized your graph template, sharing your work is a breeze. Playground allows you to export your finished graph in multiple formats, making it easy to embed in presentations, reports, or even share on social media. Additionally, you can make a wide array of edits to ensure that your graph perfectly fits your vision. With Playground's user-friendly tools and extensive library of graph templates, creating stunning data visualizations has never been easier. Dive in today and discover how our free templates can transform the way you present data.
Browse templates
- Cleaning
- Healthcare Logo
- Onam Poster
- Dj Logo
- Glitch Background
- Highlight Cover Black
- Menu
- Red Background
- Food Png
- Anime Wallpaper 4k Pc
- Nature Background
- iPhone Png
- Presentation Border
- Love Cartoon
- Morning Rose
- Volleyball Background
- Lightning Png
- Mockup Perfume
- Trader Wallpaper
- Floral Design Png
- Raksha Bandhan Drawing
- Tiranga Wallpaper Hd 1080p Download
- Dark
- Merry Christmas Happy New Year